费城区位分析
Mapping Philly
由专筑网李韧,曹逸希编译
最近,我一直在旅行,已经有一段时间没有工作了。这次我将为大家带来城市区位分析的教程,在每个项目的起始部分,我一般习惯于用这一系列的地图定位或者图表让大家对项目产生明确的概念。
I have been traveling quite a bit lately which means it has been a while since my last post. I figured I would ease back into this with some mapping studies that I have been experimenting with. I have always liked the idea of locating a project at the beginning of the portfolio with a series of maps or diagrams to help orient the viewer.
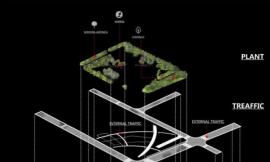
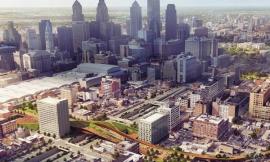
整个区位分析将从东部海岸的视角逐渐拉近。为了更加形象,我将整个图面的外部做出了模糊的效果,这样会让图像看上去更加有层次。此时我还是需要一些文字说明,但底图仍然是分析图的本质。下面我将按步骤为大家讲解。
The first starts with an extremely pulled out view of the East Coast and slowly zooms in with each addition map. Graphically, I played around with blurring as a hierarchy tool which ended up leading me down a path of creating a look similar to layers of trace paper. I still need to add much more text and information overlays, but the foundation is there for each map. Below is a quick explanation of how I created the “trace paper” look.
1、描边
第一步非常简单,用笔刷将地图的轮廓描绘出来。线性工作并不难,也不需要过于精准,因为在后期我们需要用上模糊的效果。但切记一定要分图层操作。
1. Trace the Edges
The first step was pretty straight forward. I traced a map using the Paint Brush tool and black paint. The line work was mostly done free-hand since I knew I would be blurring later and therefore didn’t need to be super precise. Be sure to keep the line work on its own layer.
2、填充水域
为了让水域和陆地能够区分开来,我运用了一种低明度的灰色来填充水域。
2. Water Tone
To define the water from land, I poched the water with a subtly darker shade of grey.
3、提亮与模糊
为了表达出线条在多层拷贝纸下方的效果,我首先将线条的灰度降低至50%,然后通过“滤镜>模糊>高斯模糊”的步骤,让线条稍显模糊,模糊半径约为2个像素。
3. Lighten and Blur
To start creating the effect of having the line work below several layers of trace paper, I first lighten the line work to almost a 50% grey. I then went to “Filter>Blur>Gaussian Blur” and blurred the line work with a radius setting of about 2 pixels.
4、进一步模糊
接下来,我将线条图层复制,并再次进行“滤镜>模糊>高斯模糊”的操作步骤,此时将模糊半径设置为8个像素,从而让新图层也变得模糊。接着再将这个图层的透明度调至50%,这样让整个画面看上去更加柔和。
4. More Blur
Next, I duplicated the line work layer and blurred this new layer by again going to “Filter>Blur>Gaussian Blur” and setting the radius to 8 pixels. I then lowered the opacity of this layer to 50%. This move will give the line work even more softness while maintaining some definition.
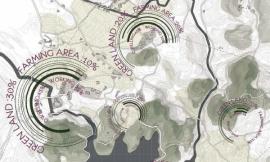
5、调色
此时我还有一些信息需要表达,于是我再添加一个图层,同时我仍然让新添加的元素保持柔和就像线稿一样,于是我对这些黄色的圆圈重复了上述步骤。
5. Some Color
I had some more information that I wanted to overlay onto this map, but I still wanted to keep these elements soft like the line work, so I repeated these steps for the yellow circles.
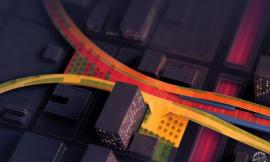
6、加强对比
为了达到在拷贝纸上手绘出来的效果,此时的图面需要一些清晰的元素来与模糊的底图形成对比。因此,我将一些重要的城镇地点做出标记,并通过直线将它们与费城连接。
6. Sharp Contrast
For the “trace paper” effect to work, there needs to be some really sharp and saturated elements to contrast the blurred desaturated elements. I therefore painted in some markers representing important towns with some line work connecting them back to Philadelphia.
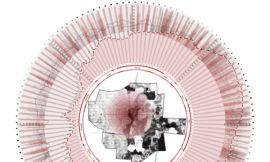
7、添加杂色
为了让图面看上去更具肌理感,我添加了一些杂色。首先创建一个新图层,然后填充50%的灰色,接下来的操作步骤是“滤镜>杂色>添加杂色”,在“添加杂色”的选项中,数量设置为9,高斯分布,并勾选“单色”。最后,将该图层混合模式设置为“叠加”,这样整个画面就有了一种模糊的肌理效果。
7. Noise
To finalize the “trace paper” effect, I added some noise. I created a new layer at the top of the layer stack and filled it with 50% grey. I then went to “Filter>Noise>Add Noise”. In the Add Noise dialogue box, I set the Amount to “9”, the Distribution to “Gaussian”, and checked “Monochromatic”. Finally, I set the Blend Mode of this layer to “Overlay”. This gives the subtle effect of paper fiber and one more layer of blur.
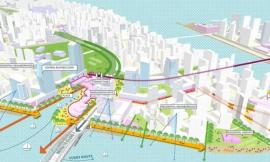
8、成图
我一开始已经说过,在这些底图上仍然需要添加大量的信息,但此时底图已经完成,我们只需要在其中添加所需要的信息即可。我通过底图制作出了4张不同的区位分析图,从而来表达最初的设计分析理念。
其他教程敬请期待。
8. The Works in Progress
Like I said at the beginning, there is still a lot of information to be overlaid on top of these maps, but the foundation is in place with each map building off of the others information. I am also going to experiment with possibly placing all 4 maps on a single spread or keeping the two spread layout I have now. More to come later.
出处:本文译自visualizingarchitecture.com/,转载请注明出处。
|
|
专于设计,筑就未来
无论您身在何方;无论您作品规模大小;无论您是否已在设计等相关领域小有名气;无论您是否已成功求学、步入职业设计师队伍;只要你有想法、有创意、有能力,专筑网都愿为您提供一个展示自己的舞台
投稿邮箱:submit@iarch.cn 如何向专筑投稿?